
Great Comeback Thanks To Technical Indicators Nov. 17th 2016
Great Comeback Thanks To Technical Indicators Nov. 17th 2016
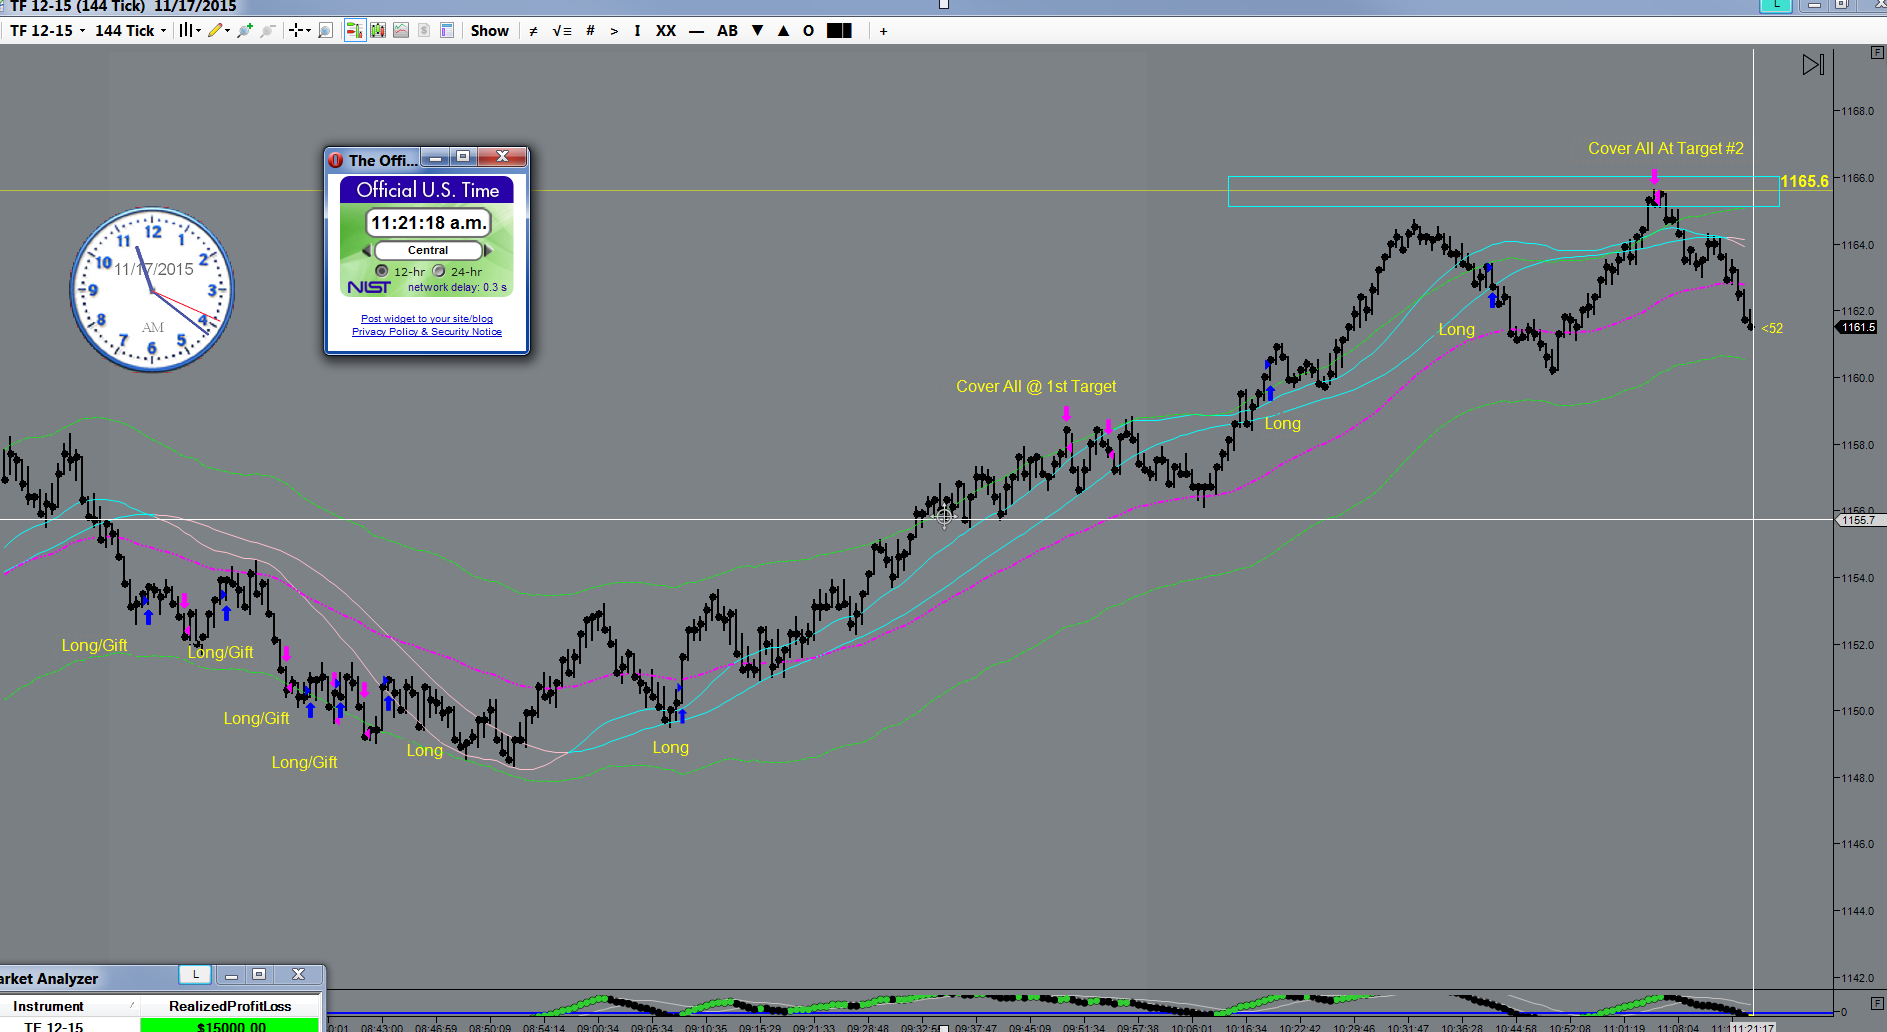
It kept saying UP, I kept asking WHEN. Strike 3 and you’re in. How far up? Ask NGL and Huey….. Technical Indicators are backtested on historic price and volume data to see how effective they would have been to predict future events. Technical Indicators, its all a numbers game. If you don’t understand the numbers, it might be something you should take into consideration before you get deeper.
In technical analysis, a technical indicator is a mathematical calculation based on historic price, volume, or (in the case of futures contracts) open interest information that aims to forecast financial market direction. Technical indicators are fundamental part of technical analysis and are typically plotted as a chart pattern to try to predict the Emini Futures market trend. Technical Indicators generally overlay on price chart data to pinpoint where the price is going, or whether the price is in an “overbought” condition or an “oversold” condition.
A basic deduction is if the market breaks the Pivot Point level up then the sentiment is bullish and the market is likely to rise. If the market price falls below the pivot point, it may be used as a new resistance level. Conversely, if the market price rises above the Pivot point, it may act as the new support level.